

How to Create Scrollable Table in Excel
- V E Meganathan
- Aug 20, 2024
- 3 min read
Today we are going to discuss about the simple methods in Excel to create scrollable table. In general practice, Data visualization nerds don't like to accommodate tables in dashboards because it consumes more space. If this is the requirement from client, then scrollable table comes to rescue to place tables in dashboards with less space.

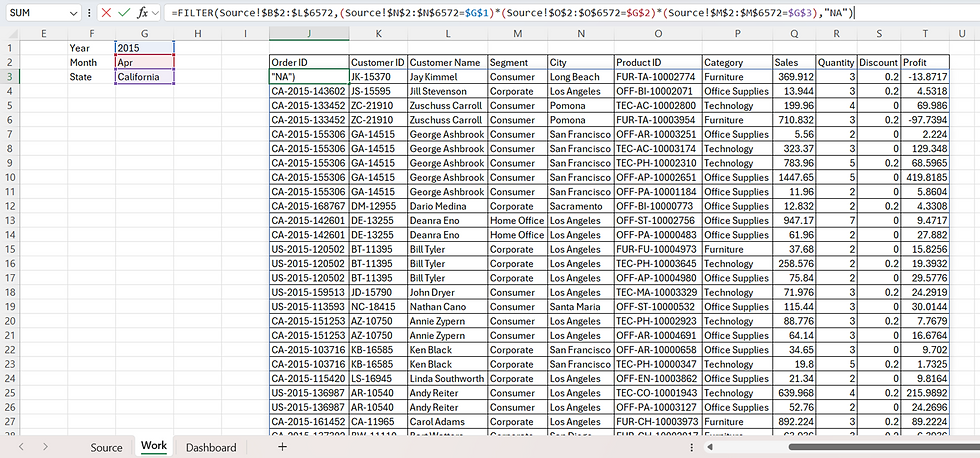
In our case, Filter applied for the year 2015, month Apr and the state California.
Total number of records matching these criteria are 32 records. Instead of showing 32 records in dashboard, we can show 10 records at a time, and we can ask clients to scroll down or up to see remaining records.
Method-1:
Excel 2019, 2021 version:
Major disadvantage of this method is that we need to have whole table with 32 records, from that table we will pick 10 records based on scrolling. So, this duplication can dent the calculation speed in larger data sets.
In our case, separate worksheet named 'work' is used for backend calculation purpose. We can pick Year, Month and State from dashboard to the sheet 'work' using below formula,
Year =Dashboard!$C$3,
Month =Dashboard!$G$3,
State =Dashboard!$K$3.
Formula in J3 cell to extract all matching records for above criteria is,
=FILTER(Source!$B$2:$L$6572,(Source!$N$2:$N$6572=$G$1)*(Source!$O$2:$O$6572=$G$2)*(Source!$M$2:$M$6572=$G$3),"NA")
Now in Dashboard, Paste column headers in B5:L5 from the table in Sheet 'work'.
Then in 'M' column, insert scroll bar from developer tab as shown below,

Once we click the scroll bar button in form controls, our mouse cursor will change into plus sign. Now move the cursor where you want to place the scroll bar and drag it down by pressing left mouse click. When the scroll bar reaches your desired size, release the left click in mouse. While keeping it selected, press CTRL + 1 to open the format control dialog box and set the properties as shown below and press OK.

G4 cell in the sheet 'work' is linked with scroll bar, once we did this, we can see the current value of 1 in G4 cell. If we click the down arrow button in scroll bar once, then current value will become 2 because we set the increment value as 1. So, for each click of down arrow button, the value increments to 1 and for each click of up arrow button, the value decrements to 1.
In dashboard sheet, B6 cell use below formula,
=IFERROR(INDEX(Work!$J$3#,SEQUENCE(10,,((Work!$G$4-1)*10)+1),SEQUENCE(,11)),"")
Refer all matching records in the sheet 'work' in array argument of INDEX function,
in row_num argument,
SEQUENCE(10,,((Work!$G$4-1)*10)+1)
This will create sequence of numbers for 10 rows, But the starting position depends on the current value of scroll bar selection.
If it is 1, then 1-1 is 0, multiply 10 with 0 will give 0 and add 1 to get the result 1.
So, sequence will deliver 1 to 10.
If it is 2, then 2-1 is 1, multiply 10 with 1 will give 10 and add 1 to get the result 11.
So, sequence will deliver 11 to 20.
Col_num argument will always be the sequence of numbers from 1 to 11, se we can use
SEQUENCE(,11).
Now, click on the down arrow and up arrow button to view the scrollable table.
Method-2:
Office 365 version:
We can eliminate the intermediate step of having the table in sheet 'work' in Office 365 version. We can create entire construction in Dashboard sheet that too in single cell.
Formula in B6 cell is,
=LET(Cv,Work!G4,a,FILTER(Source!$B$2:$L$6572,(Source!$N$2:$N$6572=C3)*(Source!$O$2:$O$6572=G3)*(Source!$M$2:$M$6572=K3)),
REDUCE("",SEQUENCE(Cv),LAMBDA(x,y,DROP(TAKE(a,Cv*10),(Cv-1)*10))))
Here, TAKE and DROP functions in Lambda helper function REDUCE, does the INDEX part of method -1.
Consider that current value of scroll bar is 1, then
TAKE function will take first 10 rows of filtered table and DROP function drops 0 rows at top.
If current value of scroll bar is 2, then
TAKE function will take first 20 rows of filtered table and DROP function drops 10 rows at top.
If the current value of scroll bar is 3, then
TAKE function will take first 30 rows of filtered table and DROP function drops 20 rows at top.
In that case, we will always show 10 records in dashboard.
Comments